
Deprivation Ranking
As the 14th most deprived local authority in the country Hastings has dropped two positions since the last survey five years ago; data analyst JAMES PRENTICE explains what lies behind the figures
This dataset outlines the level of deprivation relative to the rest of England, which is divided into over 33,000 neighbourhood areas – that’s each local council ward divided into three. There are 53 local neighbourhood areas in the Borough of Hastings.
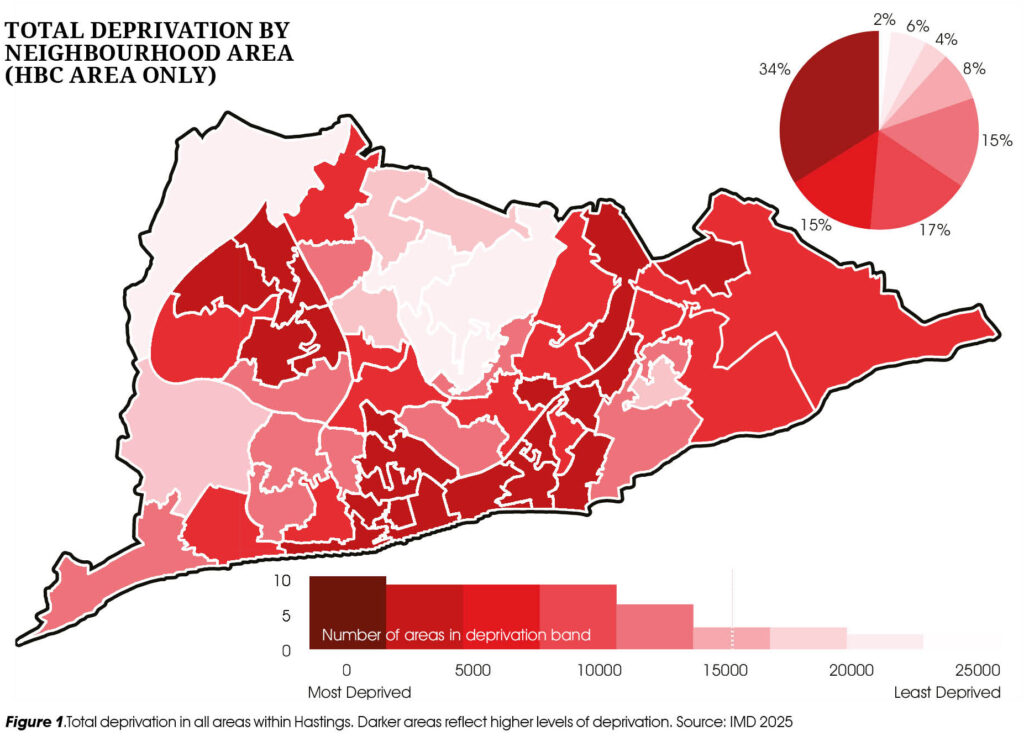
Deprivation is calculated using a combination of factors: income, employment, education, health, local living environment and access to housing and services. The lower an area’s score, the more deprived it is assessed to be relative to the rest of the country.
A third of local people live within the most deprived 10% of all areas in England, and nine local areas are within the top 3% of most deprived localities. It is estimated that 15,000 people – 16.5% of the population – live within these areas. Children are disproportionately affected, 20% being in these localities.
Overall Deprivation
On average, our most deprived council ward is Central St Leonards, closely followed by Hollington. Castle, Gensing, Baird, Tressell & Wishing Tree also score poorly, indicating pockets of high deprivation. The wards of Conquest and St Helens were the only two wards that scored above the English average, indicating that these areas contain a degree of affluence.

The area where deprivation is highest is in East Baird, which covers Broomgrove, Malvern Way and Southdown Avenue. Central Tressell – Halton Crescent and Priory Road – also scores very high in deprivation, ranked as the 25th most deprived area.
32% of the local population – and 37% of all children in Hastings – live in the highest levels of deprivation. Two-thirds of all areas within Hastings are ranked in the bottom 30% of the country – see Figure 1. Currently 63,300 people in Hastings – 73% of the population – live in the poorest three deciles, highlighting the extent of relative poverty within the town. The most deprived areas of the borough continue to be located in the borough’s central southern parts, the Hollington and Wishing Tree estates and the Ore/Baird Valley area in the east.
Figure 1 demonstrates that intense pockets of deprivation coexist closely with areas of affluence. This is a continuation of previous trends. Further, the data highlights how inequality in the town has extended, with the gap between the ranks of the most deprived and affluent areas increasing by over 1,000.
Main drivers
The main cause of the town’s deprivation is poor housing and services. An individual is assessed to be deprived of housing and key services if they can’t access or afford them.
The most housing-deprived localities are the northern part of Ore, the central part of Tressell and the eastern part of Baird. All fall within the 100 most deprived localities in the whole of England, meaning 6% of the population in Hastings lives within the most housing-deprived areas in England. Again, children disproportionately live in those areas, accounting for 10% of all children in the borough.
Taking council ward housing deprivation averages, 11 out of 16 council wards fall into the bottom 10%. This means that 63,350 people – 69% of the population in the town – live in areas with very limited housing affordability and service accessibility, with children more likely to reside within these areas.
The main reason Hastings scores so poorly is because of the town’s historic barriers to accessing services, with poorly built and neglected estates built on the edges of the town. Such areas have limited public transport, with many anyway not able to afford it. Further, some buildings are old, damaged, poorly maintained and unsuitable, leading to poor housing scores. Additionally, an acute housing crisis in the last five years means the town has gone from relative affordability to being uneconomical within a short period.
Slipping down the rankings
Due to this, 17 out of 53 localities have slipped down the rankings. Areas in Silverhill, Tressell and Old Hastings saw particularly strong increases in housing deprivation. Thus 31% of the total population of Hastings has experienced a large increase in housing and service deprivation relative to the rest of England since 2019. This indicates that, relative to the rest of England, the housing and cost-of-living crisis has made the town and its population more exposed to poverty.
Employment and Health deprivation are the next most impactful factors. Both produced lower scores than in 2019, indicating that increasing unemployment levels and worsening health in the town are contributing to greater deprivation. Low scores in education and crime also contribute, although these scores did not change from 2019, suggesting they are unlikely to be responsible for the recent increased poverty in the town.
Low income also plays a part in generating higher-than-average deprivation scores. Yet the average income has increased. This indicates that new arrivals with more money may be improving the town in some dimensions, but increasing poverty in others, such as by worsening housing affordability.
Overall, if these trends continue without intervention, it is likely that deprivation and inequality within the town will continue to grow between now and the release of the next indices of deprivation in 2030.
We hope you have enjoyed reading this article. The future of our volunteer led, non-profit publication would be far more secure with the aid of a small donation. You can also support local journalism by becoming a friend of HIP. It only takes a minute and we would be very grateful.

Leave a Reply